Indian Pharmaceutical Industry is now recognized 3rd largest in terms of volume globally and 11th largest in terms of value as per recent data of 2023. Growth and profitability of pharmaceutical companies is driven by multiple factors. Multiple studies have shown that factors such as firm size (as measured by total sales), liquidity (current ratio), market power, company efficiency (assets turnover), firm’s growth, etc. affect the profitability. Profitability ratios are used by companies to measure their performance. These ratios include Earnings before Interest, Tax, Depreciation and Amortisation (EBITDA) margin, gross margin, net profit margin, Return on Capital Employed and Return on Net Worth. Companies extensively apply profitability ratios for the purpose of determining the compensation of executive directors.
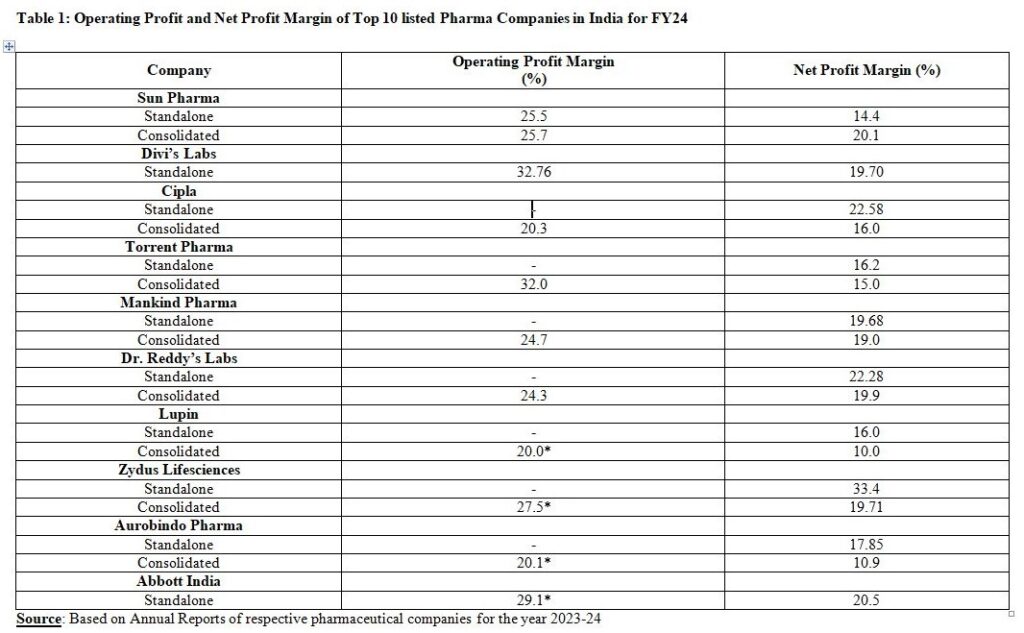
Pharmaceutical companies in India vary in terms of their revenue streams. Geographic reach also varies from company to company, e.g., Sun Pharma holds top position in Indian pharmaceutical market. India formulations sales of the company were at ₹149 Billion, but it accounted for 31 per cent of the overall revenues of the company. The company was ranked number 1 by prescriptions with 12 different classes of doctors (February 2024 MAT figures). Pharmaceutical companies face different challenges in different markets, and these markets differ widely in contribution to profit margins for these companies, e.g., standalone net profit margin of Sun Pharma was 14.4 per cent but consolidated net profit margin stood at 20.1 per cent for FY24. There are significant differences in segment-wise profitability.
Profitability of any company has relevance for dividend decisions, i.e., dividend payout by the company to its shareholders, or retention for ploughing back the profits. Pharmaceutical companies in India are expected to increase their R&D spending if these companies want to stay ahead in the race as now biologics are taking over. Indian pharmaceutical companies cannot stay on their existing laurels. These companies need to diversify their portfolio. Profitability is necessary for pharmaceutical companies to invest in new product development, in mergers and acquisition deals to become bigger in size, to plough back profits for sustainable growth, to invest in ESG initives, to replace old assets, to grow organically, etc.
Domestic pharmaceutical companies must deal with regulatory issues which may arise from time to time. To deal with risks arising from geo-political developments, companies need sufficient profits as observed recently due to potential tariff imposition in the US market. To compete with Pharma MNCs which have deeper pockets, domestic companies need adequate profit. Facts speak in this regard, e.g., Top-ranked pharma company Johnson & Johnson in 2024 reported sales of $88.8 Bn. Bristol Myers Squibb had a revenue of US $48.3 Bn with a gross profit of $34.3 Bn in FY24. AstraZeneca had a revenue of $54.1 Bn and a gross profit of $43.9 Bn. Operating Profit of AstraZeneca for FY24 stood at $10.0 Bn. In contrast to this, India’s pharmaceutical market for FY 2023-24 was valued at US $50 bn with domestic consumption valued at US $23.5 bn and export valued at US $26.5 bn.
At the same time, it is also important that profits are not exorbitant and hurt the patient and payer.
Multiple studies have touched profitability aspect of pharmaceutical companies and related aspects.Institute for Business in Global Society (2023, July), Harvard Business School shared that Big Pharma can simultaneously earn additional profits and expand access to lifesaving drugs.Ledley Fred D. et al (2020) observed that the median net income from 2000 to 2018 when expressed as a percentage of revenue, was significantly greater for 35 pharma companies compared to 357 non-pharmaceutical companies, i.e., 13.8 per cent vs. 7.7 per cent.The study also found that large pharma companies were more profitable than other large companies, although the difference was smaller when controlling for differences in aspects such as company size, R&D expense, and time trends.Lim, H. and R. Rokhim (2020) examined the factors affecting profitability of 10 pharma companies in Indonesia for 2014-18. Researchers used five independent variables namely firm size, company efficiency, liquidity, market power and a firm’s growth.
A U.S. Government Accountability Office study (2017) found that sales revenue of drug industry (pharma and biotech) increased to $775 bn in 2015 from $534 bn in 2006. Further, 67 per cent of drug companies increased their annual profit margins during the same period – with margins up to 20 per cent for some companies in certain years. The study also covered R&D spending and M&A deals.
Profitability of top 25 listed pharmaceutical companies in India (in terms of market capitalization) for FY24 (results of FY25 yet to come) gives a broader overview of profitability in pharmaceutical industry. This list includes domestic pharmaceutical companies as well four foreign pharma companies’ subsidiaries which are operating in India such as Abbott, GSK, Pfizer and AstraZeneca. In J. B. Chemicals & Pharma, TAU Investment which is investment arm of KKR, held 53.78 per cent stake (exit process kicked off in late-January 2025).
*EBITDA Margin
For FY24, Operating Profit margins of Abbott India, GSK, and Pfizer stood at 29.1 per cent, 24.54 per cent and 26.0 per cent. Their respective net profit margins stood at 20.5 per cent, 20.30 per cent and 25.0 per cent. It was only AstraZeneca that had lower operating profit margin of 15.98 per cent and lower net profit margin of 12.5 per cent. Even then it was in double digits.
Profitability of Indian pharmaceutical companies vary extensively, e.g., Consolidated, and standalone operating profit margins of Sun Pharma were comparable, but net profit margin was much lower at 14.4 per cent for standalone business as compared to consolidated net profit margin of 20.1 per cent. This reflects the differences in the profitability across different markets.
For FY24, Net profit margin of four companies namely Emcure Pharma, Glenmark (consolidated basis), Laurus Labs, and Piramal Pharma stood at 4.64 per cent, 3.41 per cent, 3.20 per cent on standalone basis (and 4.60 per cent on standalone basis), and 0.22 per cent respectively. These margins were very much on the lower side. In other words, five Indian pharmaceutical companies out of 25 in terms of market capitalization reported less than 5.0 per cent net profit margin including net loss reported by Wockhardt.
Divi’s Labs, Torrent Pharma, Eris Lifesciences, and Suven Pharma reported more than or equal to 30 per cent operating profit margin for FY24. This was also reflected in their respective Net profit margins of 19.70 per cent, 16.2 per cent on standalone basis (and 15.0 per cent on consolidated basis), 20.16 per cent on standalone basis (and 21.50 per cent on consolidated basis) and 28.0 per cent. Suven Pharma was the only exceptional player with an Operating Profit margin of 43.0 per cent on standalone basis and 35.23 per cent on consolidated basis. Next player that came close to Suven Pharma was Eris Life with a consolidated operating profit margin of 36.0 per cent and 21.50 per cent net profit margin on consolidated basis for FY24.
32 per cent pharma companies, i.e., 8 out of top 25 pharma companies in terms of market capitalization had an Operating Profit less than 20 per cent for FY24. Just one pharmaceutical company namely Wockhardt, had an Operating Profit below 10.0 per cent. One pharma company out of 25 had an Operating Profit in the range of 10-15 per cent. 6 out of select 25 pharma companies had an Operating Profit in the range of 15-20 per cent, and another 7 pharma companies had an Operating Profit in the range of 20-25 per cent. 6 pharma companies had an Operating Profit in the range of 25-30 per cent and just 4 pharma companies out of 25 had an Operating Profit more than 30 per cent.
5 out of top 25 pharma companies had a Net Profit margin below 5 per cent including net loss for one company and all these companies are domestic companies. Just one company – Ipca Labs had net profit ratio in the range of 5-10 per cent. 6 out of 25 pharma companies had a net profit margin in the range of 10-15 per cent and 5 out of these 6 companies were domestic companies. 8 pharma companies had a net profit margin on standalone basis in the range of 15-20 per cent. Seven (07) pharma companies (2 MNCs and 5 domestic) had a net profit in the range of 20-25 per cent. Two pharma companies which had a net profit margin in the range of 25-30 per cent included one domestic company (Suven Pharma) and one pharma MNC (Pfizer).
For 10 out of 25 pharma companies, either the ROCE or Net Worth had declined in FY24 as compared to FY23 or it had remained static. For Sun Pharma and DRL, it remained static. Decline in ROCE or RoNW was significant for Laurus Labs, Pfizer, and Eris Lifesciences. For 15 out of 25 pharma companies, improvement was visible in ROCE/RoNW. ROCE remained below 5 per cent for three Indian pharmaceutical companies. For 20.0 per cent pharma companies, ROCE or RoNW remained in the range of 5-10 per cent. For 20.0 per cent pharma companies ROCE or RoNW remained between 10-15 per cent. For 3 companies, ROCE remained in the range of 15-20 per cent. For 20.0 per cent companies, ROCE or RoNW remained in the range of 20-25 per cent. The highest ROCE or RoNW was observed in case of GSK (53.40 per cent), followed by Abbott India (34.9 per cent), AstraZeneca (31.1 per cent), and Ajanta Pharma (31.07 per cent).
Dr. Anil Kumar Angrish-Associate Professor (Finance and Accounting), Department of Pharmaceutical Management, NIPER S.A.S. Nagar (Mohali), Punjab
Disclaimer: Views are personal and do not represent the views of the Institute.